Existing Needs
A. POPULATION CHARACTERISTICS
B. POPULATION GROWTH
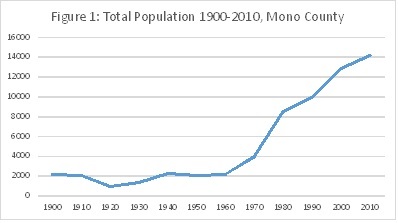
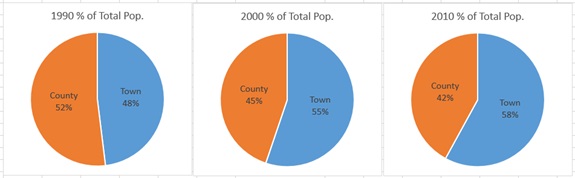
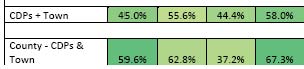
Population growth trends in Mono County and its only incorporated city, the Town of Mammoth Lakes, continue a long-term trend of steady growth that began around 1960 (Figure 1). The highest rate of growth occurred in the 1970s and 1990s. In the 1990s, the percentage of the County’s total population living in the town of Mammoth Lakes increased from 48% of the total population in 1990 to a majority 55% in 2000 and again increased up to 58% in 2010 (Figure 2). The California Department of Finance projects a modest population increase rate of .7% per year through 2013 (Table 1).
Source US CensusFigure 2: Town/County % of Total Population 1990-2010
Source: US Census
Table 1: Population Trend, Unincorporated County
| Year | Population | % Change | Annual % |
|---|---|---|---|
| 1980 | 4460 | ||
| 1990 | 5171 | 15.9 | 1.6 |
| 2000 | 5759 | 11.4 | 1.1 |
| 2010 | 5968 | 3.6 | 0.4 |
| 2011 | 6103 | 2.2 | 2.2 |
| 2012 | 6144 | 0.7 | 0.7 |
| 2013 | 6186 | 0.7 |
0.7 |
Source: US Census, CA Dept. of Finance
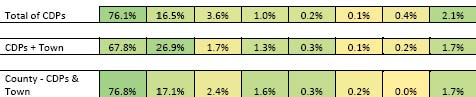
Table 1.2: Population by CDP, 2010
| Total Population | % of Countywide Population | % of Countywide- Town | % of CDP Population | |
|---|---|---|---|---|
| Countywide | 14,202 | 100.0% | ||
| Mammoth Lakes | 8,234 | 58.0% | ||
| Countywide-Town | 5,968 | 42.0% | 100.0% | |
Mono County CDPs |
||||
| Crowley Lake | 875 | 6.2% | 14.7% | 16.4% |
| Walker | 721 | 5.1% | 12.1% | 13.5% |
| Chalfant | 651 | 4.6% | 10.9% | 12.2% |
| June Lake | 629 | 4.4% | 10.5% | 11.8% |
| Bridgeport | 575 | 4.0% | 9.6% | 10.8% |
| Coleville | 495 | 3.5% | 8.3% | 9.3% |
| Benton | 280 | 2.0% | 4.7% | 5.3% |
| Lee Vining | 222 | 1.6% | 3.7% | 4.2% |
| Swall Meadows | 220 | 1.5% | 3.7% | 4.1% |
| Sunny Slopes | 182 | 1.3% | 3.0% | 3.4% |
| Mono City | 172 | 1.2% | 2.9% | 3.2% |
| Paradise | 153 | 1.1% | 2.6% | 2.9% |
| Aspen Springs | 65 | 0.5% | 1.1% | 1.2% |
| Topaz | 50 | 0.4% | 0.8% | 0.9% |
| McGee Creek | 41 | 0.3% | 0.7% | 0.8% |
| Total of CDPs | 5,331 | 37.5% | 89.3% | 100.0% |
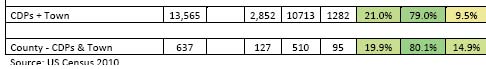
| CDPs + Town | 13,565 | 95.5% | ||
| County-CDPs & Town | 637 | 4.5% | 10.7% |
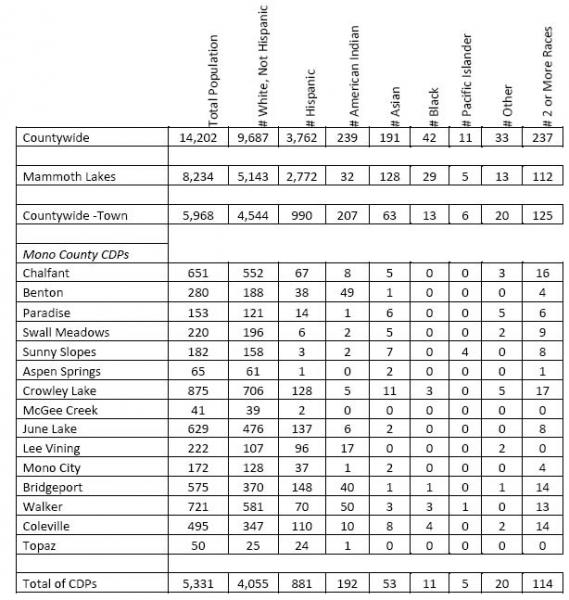
Table 2: Total Population Count by Race, CDP, Mono County 2010
ETHNICITY
In the 1990 census, the ethnic composition of Mono County was predominantly white (93%), with 3.7% American Indian, <1% Black, 1.3% Asian, and 1.9% Other Race. Persons of Hispanic Origin, which includes people of all races, encompassed 11.3% of the population. In 2000, the population was 85.4% white, 4.8% American Indian, <1% Black, <1% Asian, <1% Pacific Islander, 6.0% Other Race, and 2.4% two or more races. While this seems a drop in the white population, it probably reflects more of a change in the way ethnicity was tabulated in the census data rather than a real change in the population. In 2010, the population was 76.1% white, 16.6% Hispanic, 3.5% American Indian, 2.1% 2 or more races, 1.1% Asian and less than .3% Black, Pacific Islander and Other Race (Table 2 & 3). The data shows a continued increase in the Hispanic population.
Table 3: Total Population Percentage by Race, CDP, Mono County 2010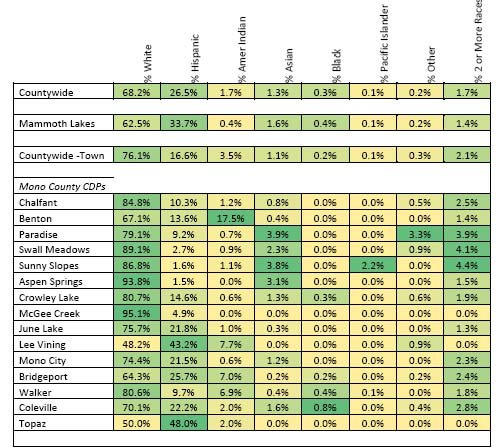
Source: US Census
The percentage of the population identifying themselves as Hispanic or Latino, of whatever race, increased in the unincorporated area, rising from 12.4% of the population in 2000 to 16.6% of the population in 2010 (Table 2 & 3), a numerical increase of 291 persons, from 699 in 2000 to 990 in 2010. During this same period, the Hispanic/Latino population in Mammoth Lakes increased from 22.2% of the town's population in 2000 to 33.7% of the town's population in 2010. The State Department of Finance is projecting that the Hispanic population in the county will rise dramatically over the next forty years, to 30% of the total County population in 2020 and 43% of the total in 2060 (see Table 4). Although Mammoth Lakes has a large Hispanic population, the rise in the Hispanic population could impact housing in the unincorporated area, as many of the Hispanic population tend to be lower-paid service workers in need of low to moderate-income housing.
Table 4: Projected Population by Race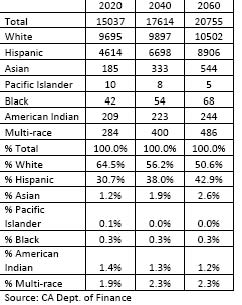
Source: CA Dept. of Finance
C. AGE
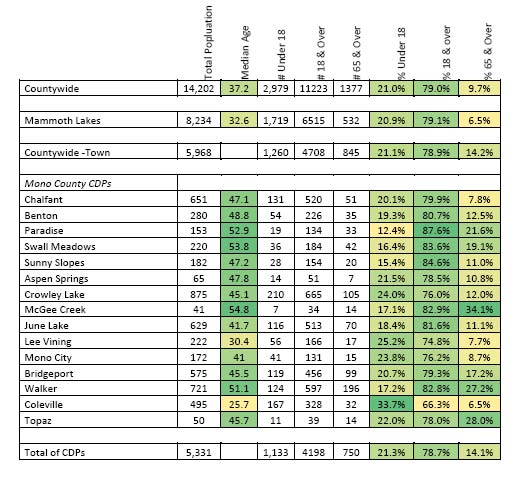
The median age in the unincorporated area is not officially calculated by the census bureau, however the average median age of the individual CDPs is 45.2, significantly older than the median age within the Town of Mammoth Lakes at 32.6. The number of seniors 65 years and older increased from 10% of the unincorporated population in 1990 to 12% in 2000, to 14.2 % in 2010. Coleville had the highest percentage of children under 18 presumably in the Marine Corps housing in Coleville. The Antelope Valley also had one of the highest percentages of seniors 65 years and older. The Long Valley/Wheeler Crest and Tri-Valley planning areas also had high percentages of children under 5 and seniors 65 years and older.
Table 5: Age Characteristics by CDP, 2010.
The State Department of Finance is projecting that the population in the county will age over the next twenty years, with the percent of the total County population that is elderly (65 years and over) rising from 14.2% in 2010 to 18.2% of the total in 2060 (see Table 10).
Table 6: Projected Population by Age
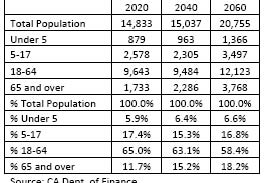
Source: CA Dept. of Finance
D. HOUSEHOLD CHARACTERISTICS
E. HOUSEHOLD SIZE
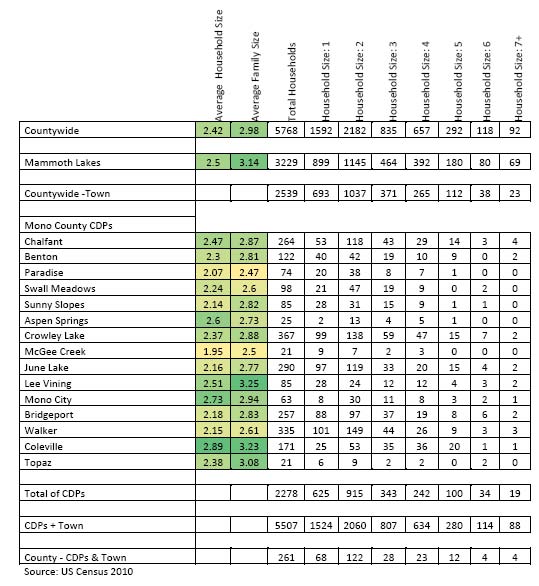
The 2010 census reports the total number of households in the unincorporated county to be 2,539 Average household countywide decreased slightly from 2.51 in 1990 to 2.42 in 2010 Coleville had the highest average household sizes, with 2.89 persons per household. McGee Creek and Paradise had the lowest average household sizes, with 1.95 persons/household and 2.07 persons per household, respectively (Table 7).
Table 7: Household Characteristics by CDP, 2010
F. HOUSEHOLD TENURE
The overall number of renters in the unincorporated area decreased from 40% of all occupied units in 1990 to 32% 2010. The south county CDPs generally have very high rates of owner occupied units, the highest being Paradise at 95.9%. North county CDPs have higher renter occupied units with Coleville the highest at 71.9% due to the marine base housing. Vacant units, used as seasonal homes are widespread and make up 32.7% of all units in the unincorporated county. June Lake has the highest rate of seasonally vacant homes at 59.4%.
Table 8: Tenure of Occupied and Vacant Units by CDP, 2010.
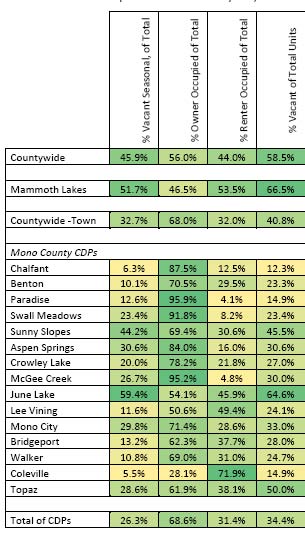
Source: US Census 2010
G. OVERCROWDED HOUSEHOLDS
The U.S. Census Bureau defines an overcrowded household as a housing unit occupied by more than one person per room (not including kitchens and bathrooms). Units with more than 1.51 persons per room are considered severely overcrowded and indicate a significant housing need. Overcrowding is not a significant housing situation in unincorporated Mono County. Using ACS data there were 47 overcrowded households, or 1.8% of the total households in the unincorporated area (Table 9). The statewide overcrowding rate for households in 2010 was 15.2% of all households, significantly higher than Mono County. Of the 47 overcrowded households, 57% were renters. This may indicate a disproportionate overcrowded situation for renters; however, overcrowded renter households represented only 2.5% of all renter households in the unincorporated area in 2010, significantly less than the statewide overcrowding rate for renters of 23.9% in 2010. Less than1% of all households in the unincorporated area were severely overcrowded in 2010. Of the 20 households identified as being severely overcrowded, 0 of them were owner households, all 20 were renter households.
Table 9: Overcrowded Households, 2011
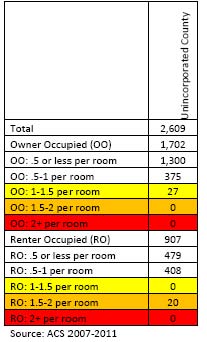
Source: ACS 2007-2011
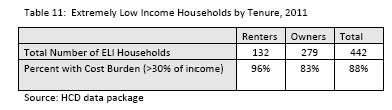
H. EXTREMELY LOW-INCOME HOUSEHOLDS
Extremely low-income households are those with income less than 30% of the area’s median income. Mono County’s median income in 2013 was $79,600. Income limits are adjusted depending on the number of people in the household. For a four-person household, the current income limit for an extremely low-income household is $19,575. For a one-person household, the income limit is $13,725.
Households with extremely low income may have a variety of housing needs. In Mono County, households receiving assistance through the CalWORKS program, Supplemental Security Income (SSI), or disability income may be considered extremely low-income households. Mono County also has a large population of service workers earning minimum wage who may fall into the extremely low-income category, depending on the number of workers in a household. The California Economic Development Department provides Occupational Employment Statistics for the Eastern Sierra Region showing wages for a variety of occupations.
Table 10: Occupational Wage Data
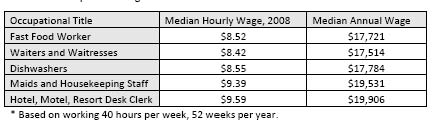
Source: California Employment Development Department (EDD), Occupational Employment and Wage Data, Occupational Employment Statistics Survey.
Estimated data on the number of extremely-low income households in the county is available through the ACS. In 2011, there were approximately 442 extremely-low income households in the unincorporated area, 17.4% of the total number of households. This is a dramatic increase from 2000 when only 7.5% of households were considered extremely low income; however, this is likely due to the small sample size of the ACS. 37% of the extremely-low income households were renters; 63% were homeowners. Households are considered to be overpaying for housing if payments for rent or mortgage are 30% or more of household income. 96% of extremely low income renters pay over 30% of their income on housing costs.
Table 11: Extremely Low Income Households by Tenure, 2011