Appendix A: 2015 Traffic Demand Projections- Unincorporated Areas
Methodology
Traffic demand projections for the unincorporated areas of Mono County are based on trip generation rates per individual dwelling units. Traditional trip generation rates are based on rates from Trip Generation, 7th edition, Institute of Transportation Engineers, which shows the average weekday trip generation rate of 9.57 trips per detached dwelling unit on a weekday. This trip generation rate is not accurate for Mono County. As an example, if 9.57 trips per detached dwelling unit were used, the community of June Lake would generate approximately 7,943 daily trips (830 dwelling units x 9.57). The highest Annual Average Daily Traffic (AADT) on SR 158 and Lakeview Drive in June Lake is 1,500 trips per day, or almost five times less than the traffic projection rates on a daily basis shown in Table A-8.
Projected trip generation rates while based on land use and the number of housing units are subject to local factors such as:
- The seasonal nature of visitors which tends to increase Average Annual Daily Traffic (AADT) during summer months,
- The opening or closing of mountain passes,
- Some communities may have a high number of second homeowners,
- The rural nature of some communities from job centers or work locations,
- Not all traffic will enter and/or exit state highways at one specific location, and/or
- Other factors.
Mono County is using an extremely conservative trip generation rate of six trips per dwelling unit. The number of current dwelling units comes from the US Census 2010 and shown as a Census Designated Place (CDP). The Land Use Element lists all projected uses within the county, but to simplify trip generation, only the single-family residential designation is used. Projected trip generation is calculated two ways. The first uses all the dwelling units in a CDP multiplied by six trips per unit. The second calculation uses all occupied units and 50% of the unoccupied dwelling units in a CDP multiplied by six trips per unit. The number of projected new units assumes a 1% growth rate based on total units and occupied units plus 50% of the unoccupied units over a five-year time frame.
Traffic/Trips by Planning Area
Average Annual Daily Traffic (AADT) is the total traffic volume for the year divided by 365 to pass over a certain section of roadway in one day. Peak Month ADT is the average daily traffic for the month of heaviest traffic flow. The most current five-year traffic volume reporting period on the state highway system is from 2009 through 2014 by the California Department of Transportation, Division of Traffic Operations.
Antelope Valley
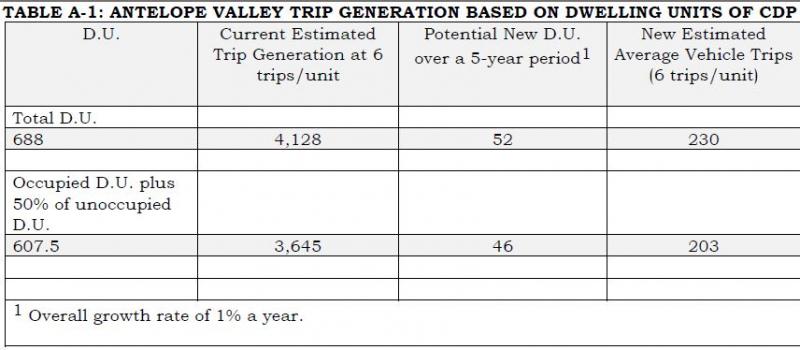
The primary thoroughfare in Antelope Valley is US 395. Any growth in the Antelope Valley has the potential to impact US 395. There are approximately 688 current dwelling units (D.U.) in the Antelope Valley. A 1% growth rate over a five-year period would result in 52 new units. An additional calculation on growth rate is made using only 50% of the unoccupied units or 46 new units over five years. Trip generation rates for the Antelope Valley are included in Table A-1 for total units and occupied units plus 50% of the unoccupied units. Both are based on six trips per single-family unit. The communities of Topaz, Coleville, and Walker potentially add 230 or 203 daily new vehicle trips (over a five-year period) to current traffic conditions in the Antelope Valley.
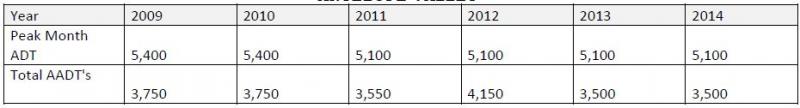
As a comparison, Table A-2 shows the annual average daily traffic (AADT) on U.S. Route 395 from 2009 to 2014 (Mill Creek Bridge and Highway 395). The most recent average daily total was 3,500 vehicles in 2014.
- If all D.U. are counted, the addition of 230 daily vehicle trips over a five year period represents a 6.5 percent increase in the average daily trips using the AADT from 2014.
- If all occupied D.U. plus 50 percent of the unoccupied D.U. are counted, the addition of 203 daily trips over a five year period represents a 5.8 percent increase in average daily trips using the AADT from 2014.
The impact of these additional trips over five years is expected to be minimal. Mono County is using a conservative trip generation rate of six trips per dwelling unit.
TABLE A-2: AVERAGE ANNUAL DAILY TRAFFIC MILL CREEK BRIDGE & HIGHWAY 395 (PM 107.105), ANTELOPE VALLEY
Bridgeport Valley
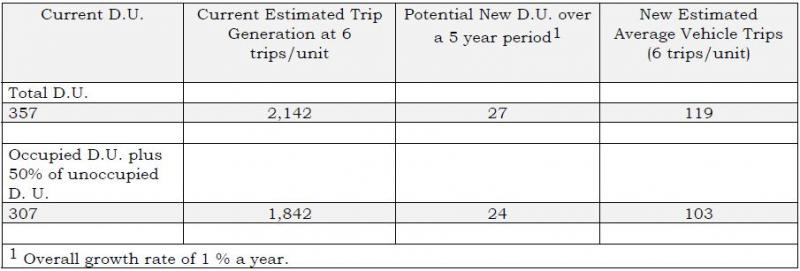
The primary thoroughfares for the Bridgeport area are Highways 395 and 182. There are currently 357 existing D.U. in the Bridgeport Valley. Trip generation rates for the Bridgeport Valley are based on six trips per single family dwelling. Bridgeport also has a large seasonal variation due to trans-sierra pass openings (Tioga 120 and/or Sonora 108) and second homeowners. Table A-3 shows generation rates in the Bridgeport Valley for total units and occupied units plus 50 percent of the unoccupied units. This could add 119 trips or 103 trips over a five year period. Both are based on six trips per single family unit.
TABLE A-3 BRIDGEPORT VALLEY TRIP GENERATION BASED ON Dwelling Units of CDP
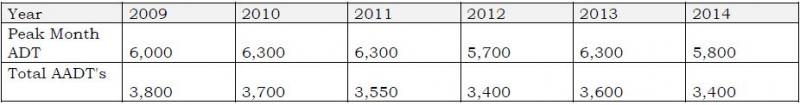
As a comparison, Table A-4 shows the annual average daily traffic (AADT) on U.S. Route 395 from 2009 to 2014 (395 & 182). The most recent average daily total was 3,600 vehicles in 2014.
- If all D.U. are counted, the addition of 119 daily vehicle trips over a five year period represents a 3.5 percent increase in the average daily trips using the AADT from 2014.
- If all occupied D.U. plus 50 percent of the unoccupied D.U. are counted, the addition of 103 daily trips over a five year period represents a 3.0 percent increase in average daily trips using the AADT from 2014.
The impact of these additional trips over five years is expected to be minimal. Mono County is using a conservative trip generation rate of six trips per dwelling unit.
TABLE A-4: AVERAGE ANNUAL DAILY TRAFFIC JUNCTION HIGHWAYS 395 AND 182 (PM 76.3), Bridgeport Valley
Mono Basin
Main travel routes in the Mono Basin area are Highways 395, 120 and 167. Trip generation rates for the Mono Basin are based on single family units. Lee Vining also has a large seasonal variation in AADT due to trans-sierra pass openings (Tioga 120 and/or Sonora 108). Trip generation rates for the Mono Basin are shown in Table A-5 for total units and occupied units plus 50 percent of the unoccupied units. Both are based on six trips per single family unit.
(INSERT TABLE A-5)
As a comparison, Table A-6 shows the annual average daily traffic (AADT) on U.S. Route 395 from 2009 to 2014 (North end of Lee Vining). The most recent average daily total was 3,600 vehicles in 2014.
- If all D.U. are counted, the addition of 70 daily vehicle trips over a five year period represents a 1.89 percent increase in the average daily trips using the AADT from 2014.
- If all occupied D.U. plus 50 percent of the unoccupied D.U. are counted, the addition of 59 daily trips over a five year period represents a 1.59 percent increase in average daily trips using the AADT from 2014.
The impact of these additional trips over five years is expected to be minimal. Mono County is using a conservative trip generation rate of six trips per dwelling unit.
(Insert Table A-6)
June Lake
Access to the community of June Lake is provided by Highway 158. Traffic generation rates for June Lake are based on single family residential units (SFR). June Lake also has the potential to have a high number of second home owners, seasonal variations, and may be influenced by trans-sierra pass openings (Tioga 120 and/or Sonora 108) which would affect the average annual daily traffic figures. Trip generation rates are shown in Table A-7 for total units and occupied units plus 50 percent of the unoccupied units. Both are based on six trips per single family unit.
(Insert Table A-7)
As a comparison, Table A-8 shows the annual average daily traffic (AADT) on State Route 158 from 2009 to 2014 (June Lake Village). The most recent average daily total was 1,500 vehicles in 2014.
- If all D.U. are counted, the addition of 274 daily vehicle trips over a five year period represents a 18.2 percent increase in the average daily trips using the AADT from 2014.
- If all occupied D.U. plus 50 percent of the unoccupied D.U. are counted, the addition of 186 daily trips over a five year period represents a 12.4 percent increase in average daily trips using the AADT from 2014.
This rate seems highly unlikely due to the fact that the estimated trip generation from all 820 existing units if occupied at one time could equal 4,920 trips on SR 158. This is three times higher than the AADT of 1,500 trips from 2014 on SR 158 as shown in Table A-8.
As stated in the methodology section, the ITE methodology of 9.57 trips per detached dwelling unit in rural Mono County results in unrealistic figures. Mono County has adjusted this methodology to a more reasonable, and still conservative, six trips per dwelling unit. This adjustment clearly continues to provide unrealistic numbers as described in the preceding paragraph; however, alternative methodology is lacking at this time. The current methodology does not account for second homeownership (e.g. a high percentage of vacant dwelling units), transient rentals and occupancy, concentrated traffic influx during limited timeframes due to tourist visitation, and a seasonal road closure that eliminates through traffic on SR 158.
The Average Annual Daily Traffic data does show a decrease on SR 158 from 2009 to 2014. . The impact of these additional trips over five years is not expected to be significant. Mono County is using a very conservative trip generation rate of six trips per dwelling unit as shown in Table A-7 with the trip generation rate exceeding the peak month ADT of 2,800.
(Insert Table A-8)
Long Valley
The primary access between communities in Long Valley is Highway 395. This area includes the Long Valley communities and Wheeler Crest. It does not include the Town of Mammoth Lakes. Long Valley trip generation rate is six trips per unit. A one percent housing growth rate over five years would add 63 new units if all dwelling units are used or 54 new units if all occupied units plus 50 percent of unoccupied units are used to calculate future growth shown in Table A-9.
(Insert Table A-9)
As a comparison, Table A-10 shows the annual average daily traffic (AADT) on US 395 from 2009 to 2014 at two different locations. The most recent average daily total in 2014 was 6,900 at McGee Creek Road and 8,300 at SR 203.
If all D.U. are counted, the addition of 281 daily vehicle trips over a five year period represents a four percent increase in the average daily trips using the AADT from 2014 at the Mc Gee Creek Road location.
If all occupied D.U. plus 50 percent of the unoccupied D.U. are counted, the addition of 240 daily trips over a five year period represents a 3.4 percent increase in average daily trips using the AADT from 2014 at the Mc Gee Creek Road location.
The impact of these additional trips over five years is not expected to be significant. Mono County is using a conservative trip generation rate of six trips per dwelling unit.
(Insert Table A-10)
Tri-Valley
The Tri Valley Area includes the communities of Chalfant, Hammil, and Benton. The primary thoroughfare is Highway 6. There are currently 460 existing dwelling units in the area. Trip generation rates for the Tri-Valley are based on single family detached housing. A one percent growth rate over five years using all occupied units would add 35 new units or using occupied units and 50 percent of unoccupied units would add 32 units. This would generate approximately 154 potential trips in the Tri-Valley area as shown in Table A-11.
(Insert Table A-11)
The additional projected 154 trips would utilize Highway 6 as this is the primary north/south route to Bishop. A lessor number of trips could utilize SR 120 in the northern portion of the Tri-Valley.
As a comparison, the average daily traffic on Highway 6 is only 1,890 at the junction of SR 120 (Benton Station) and 2,100 at Silver Canyon Road in northern Inyo County (see Table A-12).
If all 154 trips from new residential development traveled south into Inyo County, this would represent an increase of 6.4 percent of the 2014 AADT at the Inyo/Mono County Line as shown in Table A-12.
The impact of these additional trips over five years is not expected to be significant. Mono County is using a conservative trip generation rate of six trips per dwelling unit.
(Insert Table A-12)
(Insert Table A-13)
(Insert Table A-14)